Google Analytics Infographic
Download Our Free Infographic: Google Analytics
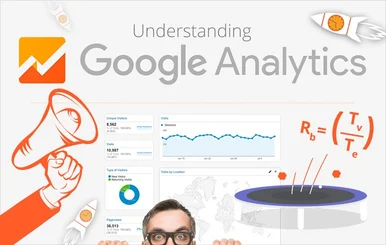
Google Analytics Reports are full of useful data about the traffic coming to your website, but what is being measured? In this infographic you will find some of the top level metrics explained so you can better understand your numbers.
 Some of the areas discussed are:
- Engagement Rate
- Bounce Rate
- Time Comparisons
- Sessions
- Views Per Session
- Mobile vs. Desktop
- Country/Location
- Goals